No Installation Required.
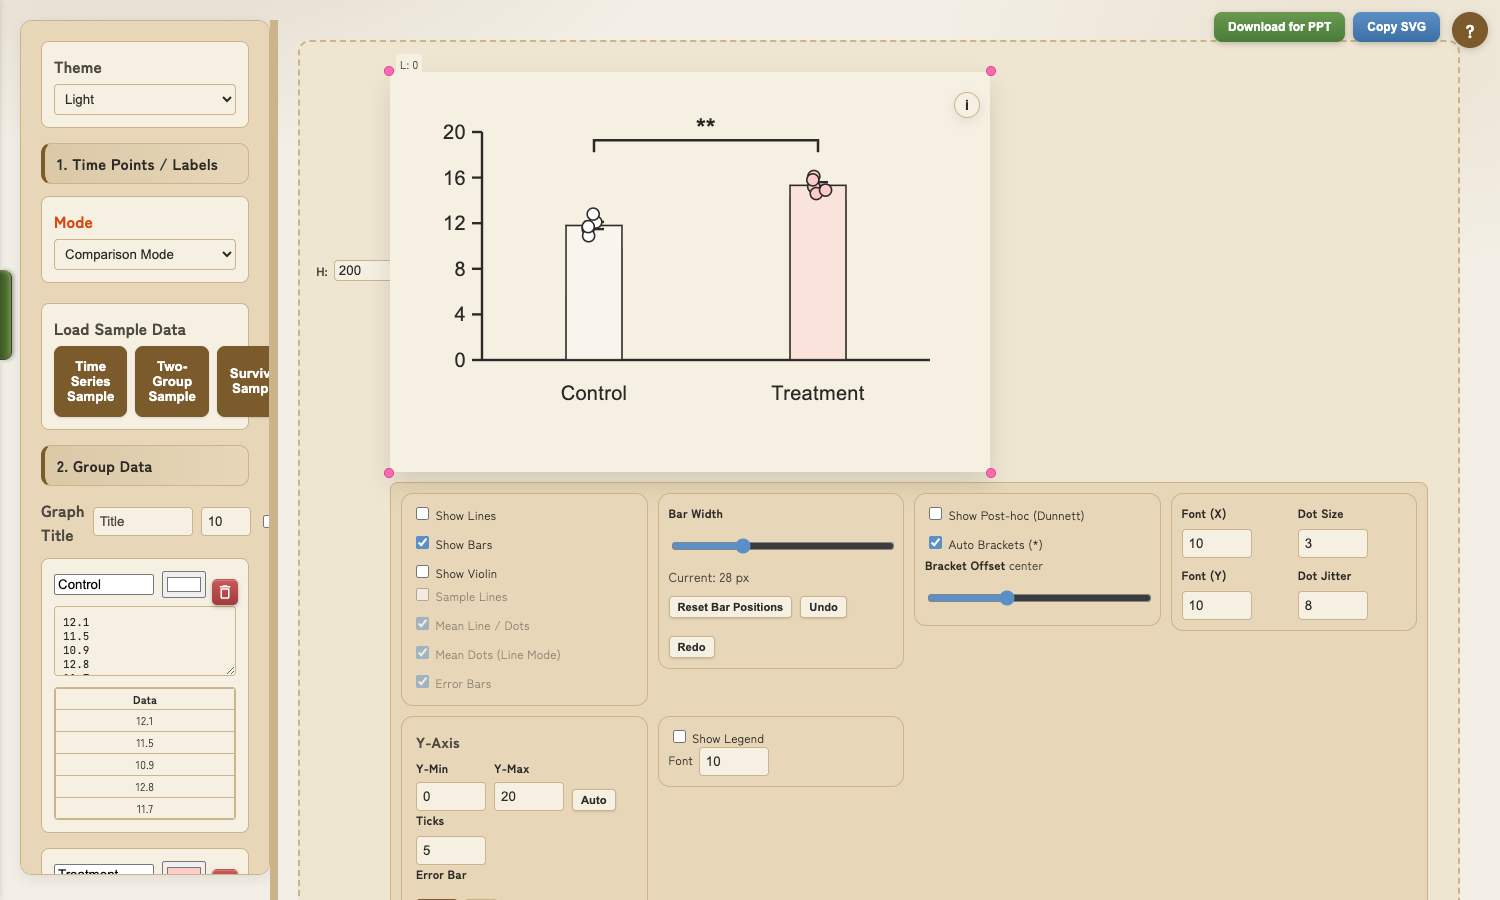
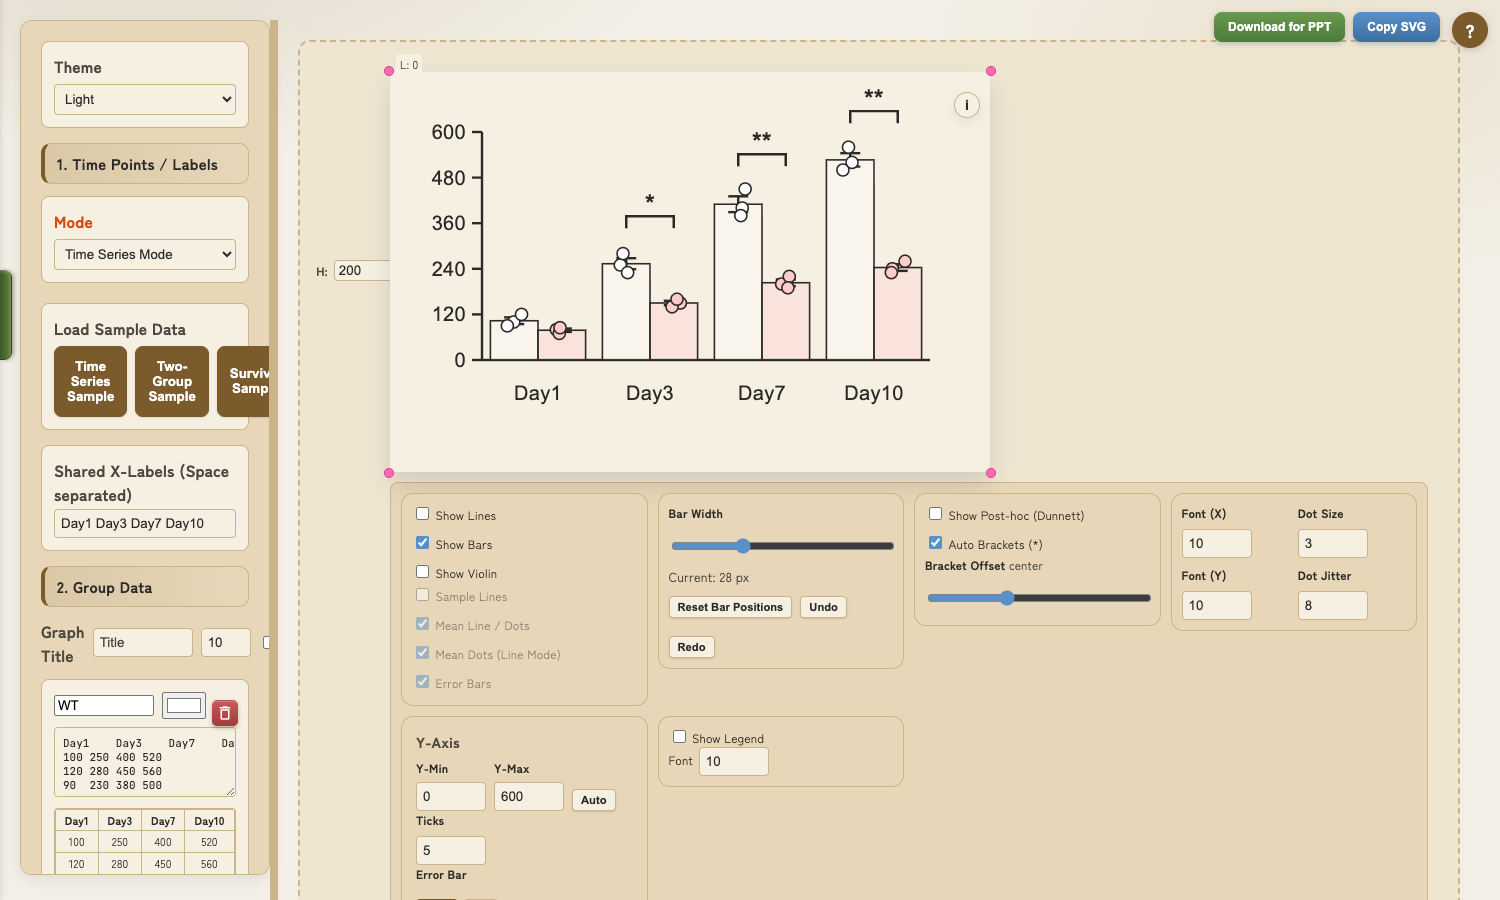
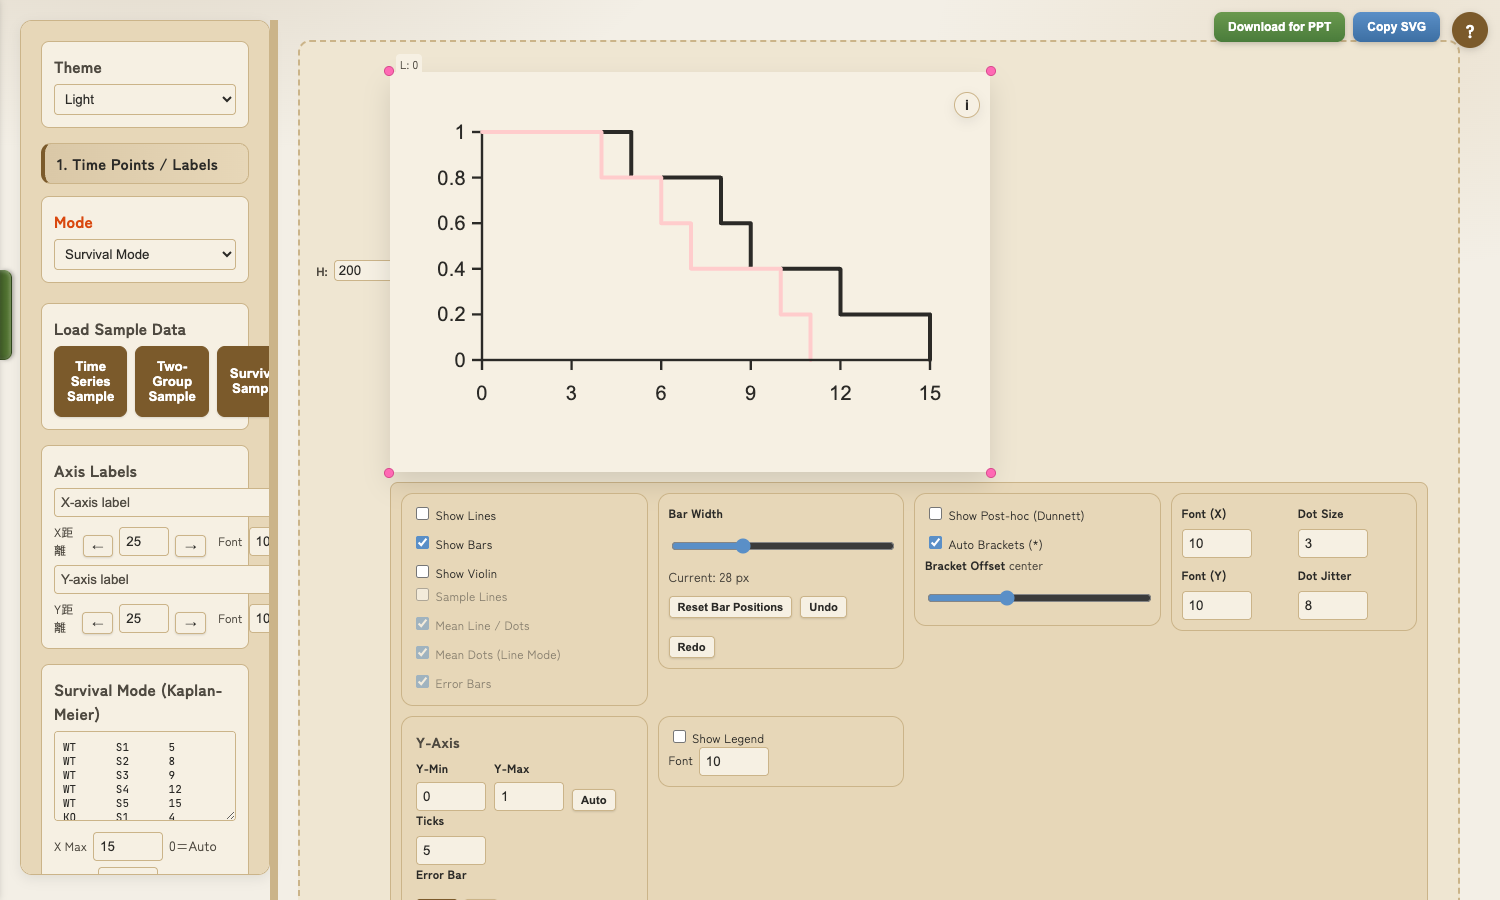
Browser-Based
Graph Creation &
Statistics Tool
for Research Papers
Input data is processed in your browser; data content is not sent to servers.
Safe for confidential research data.
No download or account required